Depth profiling
KherveFitting provides dedicated tools for visualising depth profiles from ion-sputtering experiments — typically a series of spectra acquired between successive etch steps.
Profile Creator
Open via Tools → Create Profiling, or the Profile Creator toolbar icon.
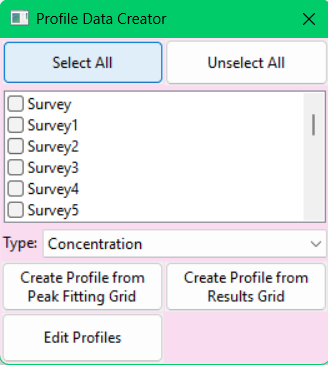
Core-level selection — checklist of all core levels in the current file. Use Select All / Unselect All for fast selection; right-click for more options.
Profile type — pick the parameter to plot against etch level or spectrum number:
- Concentration (atomic %)
- Area
- Corrected Area (RSF-corrected)
- Position (binding energy)
- FWHM
- Height
- L/G ratio
- Weight (%)
Source — extract from either the Peak Fitting Grid (current fits per spectrum) or the Results Grid (previously curated quantification).
Profile Editor
Open via Tools → Edit Profiling, or directly from the Profile Creator.
- Data table — every parameter value at every etch level; editable cell-by-cell to patch corrections.
- Etch time / depth conversion — modify the X axis to match real experimental conditions, or convert to depth using a sputter-rate calibration.
- Plot — multi-element line plot with customisable colours.
- Export to Excel — for further analysis or external presentation.
Workflow tip
Save a peak table for each core level, then apply it across the etch series (Batching tab) before opening the Profile Creator. Consistent constraints across spectra mean clean, comparable trends through the depth profile.