PCA & advanced statistics
KherveFitting includes several advanced tools beyond peak fitting: principal component analysis, D-parameter analysis, Fermi-edge / valence-band measurements, Thickogram thickness, and a plot-modification utility.
Principal Component Analysis (PCA)
For series of spectra (depth profiles, sample sets), PCA decomposes the dataset into orthogonal components, helping reveal underlying chemistry independent of operator bias.
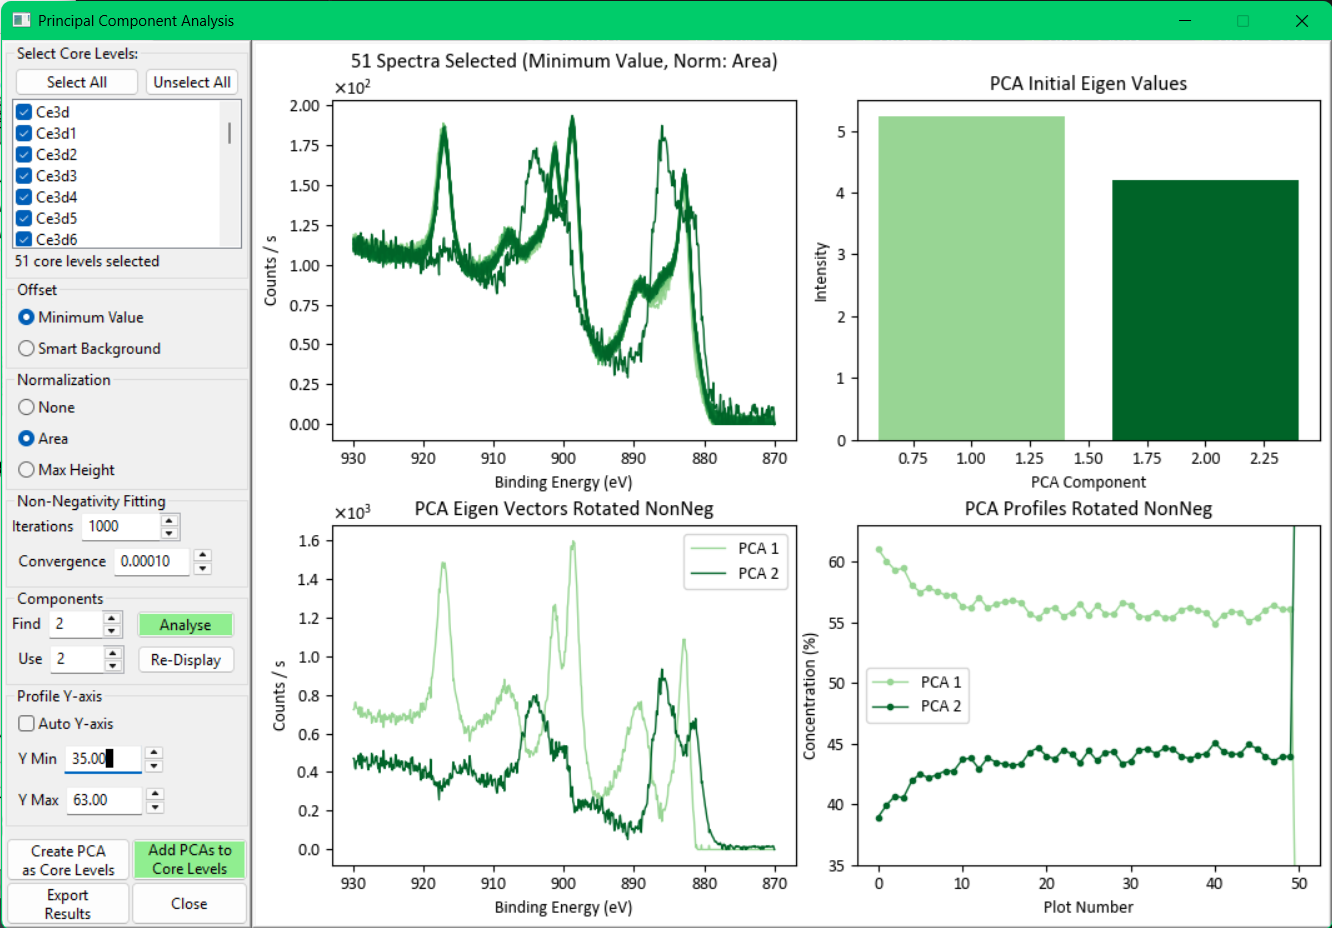
Open via Tools → PCA. Select the spectra to include, run, and explore the score and loading plots.
D-parameter analysis
Used for quantifying sp²/sp³ carbon ratios from the C KLL Auger line. KherveFitting computes the first derivative of the Auger spectrum and measures the energy separation between the maximum and minimum — the "D-parameter".
Fermi edge & Valence Band Maximum
For metallic and semiconductor samples, the Fermi edge or VBM gives a reference point for work-function and band-alignment measurements. KherveFitting fits a Fermi function for metals and a linear extrapolation to baseline for semiconductors.
Thickogram — overlayer thickness
Standard inelastic-mean-free-path (IMFP) calculation for overlayer thickness from peak ratios. Multiple IMFP methods are available (TPP-2M and others).
Plot Modification Tool
A live editor for fine-tuning a plot's appearance (colours, labels, line widths, axis ranges) before export — useful for publication-ready figures.